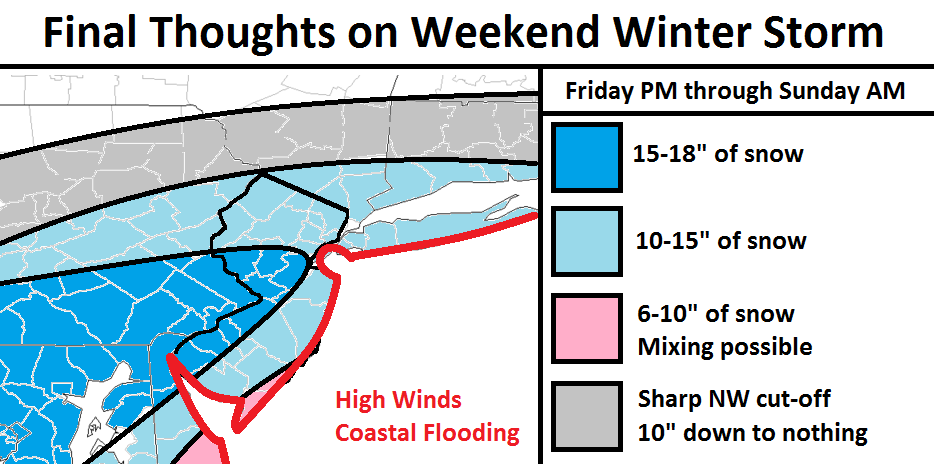
The light gray area represents a sharp cut-off of snowfall. This is due to confluence and very dry air. The difference of 20 miles N or S could mean the difference between a dusting and up to 10 inches of total accumulation.
The light blue area represents the general widespread foot+ that I expect with this system. The greatest bust potential in this area is extreme NNJ. It’s possible that light gray area could dip a little into NNJ. I openly admit this uncertainty.
The dark blue area should be the jackpot of this system. The Kaboom Zone. The possible “Dude where’s my car?” zone.
The pink area represents where accumulations can be knocked down due to the warmer waters of the Atlantic Ocean coupled with onshore flow. I also openly admit my uncertainty here as that could be a little larger into SENJ or a little smaller.
The coastal flooding aspect of this system is moderate-to-high risk. I would expect barrier islands and back bays to see water levels not as high as Sandy, but definitely up there. Shooting from the hip, expect a storm surge potential of 3-5 feet along the entire Jersey Shore with tides of 7-8 feet above MSL (Mean Sea Level).
The wind risk of this storm is also moderate-to-high. I would expect wind gusts to 40mph inland and 60mph plus along the immediate coast. Widespread power outages are most-certainly possible.
In English: Expect generally a foot of snow statewide with the potential for over-performance up to 2 feet. Extreme NNJ could be held down by the sharp cut-off and SENJ could be held down by any mixing that “may/could” occur. Expect high winds (stronger along the coast) and very high water levels along the barrier islands and back bays. Listen to your authorities and be safe! JC
Jonathan Carr (JC) is the founder and sole operator of Weather NJ, New Jersey’s largest independent weather reporting agency. Since 2010, Jonathan has provided weather safety discussion and forecasting services for New Jersey and surrounding areas through the web and social media. Originally branded as Severe NJ Weather (before 2014), Weather NJ is proud to bring you accurate and responsible forecast discussion ahead of high-stakes weather scenarios that impact this great garden state of ours. All Weather. All New Jersey.™ Be safe! JC

